


The US economy entered 2026 navigating a complex transition characterized by cooling labor markets, persistent core inflation, and cautiously restrictive monetary policy. The current economic phase reflects late-cycle expansion dynamics, with growth decelerating from 2025’s robust pace while avoiding recessionary signals. Manufacturing activity showed unexpected strength in January, expanding for the first time in twelve months, though this rebound occurred against a backdrop of tepid job creation and supply chain pressures from evolving tariff policies. The space commerce sector faces mixed conditions: NASA’s record $27.5 billion FY2026 budget provides substantial public-sector support, while private capital allocation encounters higher-for-longer interest rates and selective investment appetite.
Key economic themes include the Federal Reserve’s pivot to a holding pattern after three 2025 rate cuts, persistent shelter-driven inflation approaching but not reaching the 2% target, and bifurcated labor market performance concentrated in healthcare and leisure sectors. Major opportunities for space industry stakeholders emerge from sustained government procurement budgets and AI-related infrastructure investment, while risks center on prolonged elevated borrowing costs constraining private sector capital expenditures and potential tariff-induced cost pressures affecting manufacturing supply chains.
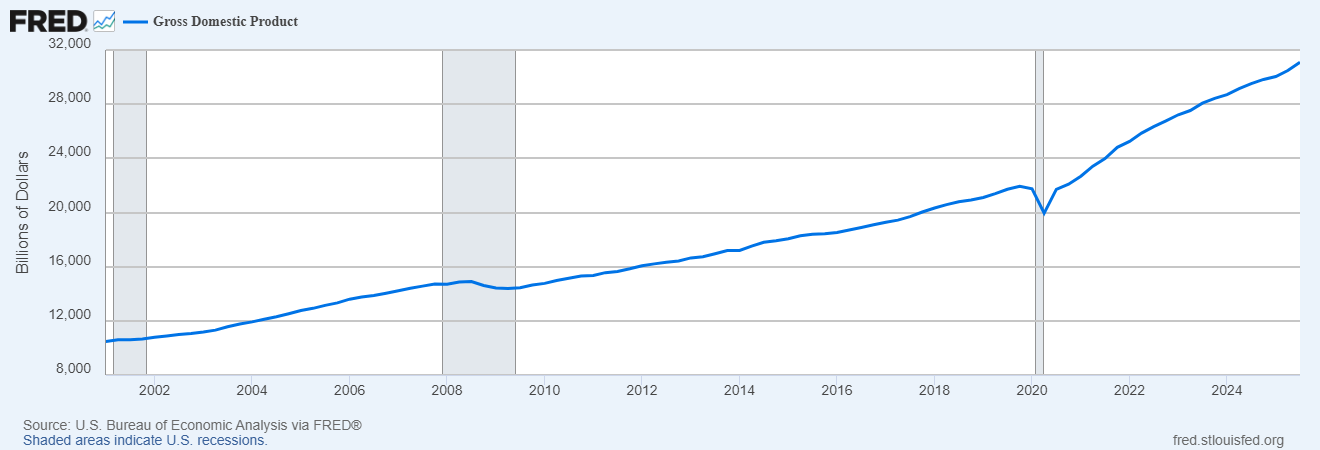
Gross Domestic Product
AnalysisRecentEconomic Performance
Fourth quarter 2025 GDP data, released with updated third quarter revisions in January 2026, revealed real GDP growth of 2.3% year-over-year for Q3 2025, down from earlier quarterly readings but reflecting continued expansion. The third quarter registered an initial estimate of 4.4% annualized growth after incorporating comprehensive source data delayed by government shutdowns. This bifurcated pattern—strong quarterly annualized rates versus moderating year-over-year trends—signals an economy transitioning from above-potential to trend-rate expansion.
Consumer spending contributed 2.34 percentage points to Q3 growth through a 3.5% increase in personal consumption expenditures, maintaining its dominant role as the economy’s primary engine. Services consumption, particularly healthcare, international travel, and professional services, drove this performance, concentrated among higher-income households. Investment presented a sharply divided picture: intellectual property and software investment surged 18% year-over-year, fueled by generative AI infrastructure build-out and contributing nearly one-third of total GDP growth, while residential investment contracted 5.1% annualized as elevated mortgage rates continued suppressing housing activity.
Net exports provided substantial quarterly support as imports declined 4.7%, largely reflecting inventory corrections from early 2025 front-loading activity ahead of anticipated tariffs. Government consumption rebounded with 2.2% growth led by federal defense expenditures, creating favorable conditions for aerospace and defense contractors including space sector participants.
Growth Trajectory and Forecast
Economic projections for 2026 anticipate deceleration to 1.4-1.7% annual GDP growth, down from approximately 2.8% in 2024, as multiple headwinds converge. The Conference Board forecasts 1.6% growth while acknowledging downside risks from tariff escalation, reduced net migration affecting labor supply and consumer demand, and the gradual exhaustion of pandemic-era excess savings. This slowdown reflects both cyclical maturation of the expansion and structural adjustments to tighter monetary conditions, higher long-term interest rates above 4.8% since August 2025, and policy uncertainties surrounding trade and immigration.
The space economy contributed $240.9 billion to overall US GDP in 2023 according to the Bureau of Economic Analysis’s Space Economy Satellite Account, supporting 373,000 jobs across manufacturing, R&D, information services, and related sectors. While comprehensive 2024-2025 space economy data awaits BEA’s next update, the sector’s integration into broader economic trends suggests both opportunities and constraints from current conditions. Robust federal procurement through NASA’s $27.5 billion FY2026 appropriation provides demand stability, but private space ventures face capital allocation challenges as venture funding remains selective and debt financing costs stay elevated.
Labor Market Analysis
Employment Conditions
The January 2026 labor market displayed minimal momentum, with private sector employment barely advancing despite avoiding outright contraction. The ADP National Employment Report, released February 4, showed private employers added just 22,000 jobs in January, falling short of the already-modest 45,000 Dow Jones consensus estimate and down from a revised 37,000 in December. This total would have turned negative without the education and health services sector’s 74,000-job contribution, illustrating the narrowing concentration of hiring activity.
Professional and business services shed 57,000 positions, manufacturing declined by 8,000, other services lost 13,000, and trade, transportation, and utilities added only 4,000 despite the sector’s traditional role as a broad employment base. Construction contributed 9,000 jobs, and financial activities added 14,000, while leisure and hospitality gained 4,000. Company size analysis revealed that mid-sized firms with 50-499 employees provided all net job growth, while smaller companies remained flat and larger employers reduced workforce by 18,000.
December’s official Bureau of Labor Statistics Employment Situation report, released in January 2026, confirmed the broader deceleration with 50,000 nonfarm payroll additions, concentrated in leisure and hospitality (+47,000) and healthcare and social assistance (+38,500), offset by losses in retail (-25,000), construction (-11,000), professional and business services (-9,000), and manufacturing (-8,000). The unemployment rate edged down to 4.4% from 4.5% as employment rose modestly despite labor force contraction, pushing the labor force participation rate to 62.4%.
Wage Dynamics and Labor Market Implications
Average hourly earnings growth stabilized at 4.5% year-over-year for workers maintaining their positions, indicating wage pressures are moderating in an orderly fashion without triggering significant real wage declines. The December data showed monthly wage growth of 0.3% with annual gains of 3.8%, suggesting gradual alignment toward inflation rates though still providing modest real wage improvements. For all of 2025, job creation slowed sharply compared with the prior year, and the BLS made small seasonal adjustment revisions that further emphasized the cooling trend.
These labor market conditions present mixed implications for space industry employment. The sector’s concentration in professional and technical occupations, manufacturing, and R&D activities places it within categories experiencing headwinds rather than tailwinds. However, government-funded programs through NASA and Department of Defense contracts provide employment stability less dependent on private sector hiring cyclicality. The 373,000 space economy jobs recorded in 2023 span diverse classifications, and sustained federal procurement budgets suggest this employment base faces limited near-term contraction risk despite broader labor market softening.
Consumer Sector Analysis
The December 2025 Consumer Price Index, released January 13, 2026, revealed core consumer prices increasing less than anticipated, reinforcing evidence of gradual disinflation. Excluding volatile food and energy categories, the CPI exhibited a seasonally adjusted monthly increase of 0.2% and an annual rise of 2.6%, both falling short of projections by 0.1 percentage points. Headline CPI recorded a 0.3% monthly increase, producing an annual all-items inflation rate of 2.7%, matching consensus estimates but remaining above the Federal Reserve’s 2% target.
Shelter costs drove persistent inflation pressures, rising 0.4% monthly in the largest gain for this category, which constitutes over one-third of CPI weighting and increased 3.2% year-over-year. Food prices surged 0.7% for the month, though egg prices plummeted 8.2%, down nearly 21% year-on-year after earlier spikes. Energy costs rose 0.3% monthly and 2.3% annually, while gasoline prices fell 0.9% monthly and 3.0% annually. Recreation expenses jumped 1.2% monthly, representing the most substantial gain since 1993.
Certain categories displayed deflationary trends: used cars and trucks dropped 1.1%, communication services decreased 1.9%, and household furnishings declined 0.5% as President Trump backed away from proposed tariff hikes on imports in that category. These mixed price movements illustrate the uneven nature of inflation’s retreat toward target levels.
Consumer Financial Health and Spending
Real consumer spending growth forecasts for 2026 project 1.4% expansion, down from 2.1% in 2025, reflecting both normalization from pandemic-era excess and moderating income growth as labor market slack increases. The personal saving rate declined sharply to 4.2% in Q3 2025, indicating consumers are sustaining spending through reduced saving rather than robust income gains. This trajectory raises sustainability questions for continued consumption-led growth, particularly among lower- and middle-income households facing persistent shelter cost inflation and limited wage growth.
High-income households demonstrated sustained discretionary spending capacity through services consumption including travel and professional services, creating bifurcated demand patterns. Store-based retail sales, excluding online purchases and restaurants, rose consistently on a monthly basis from June through year-end 2025, marking the longest such streak since 2019 and suggesting physical retail maintains relevance despite e-commerce competition.
For space commerce, consumer financial conditions influence both direct consumer space services (satellite communications, emerging space tourism) and broader economic activity supporting business-to-business space services. Moderating but positive consumption growth sustains aggregate demand for satellite-enabled connectivity, geospatial intelligence, and logistics optimization services that constitute significant commercial space revenue streams.
Business and Corporate Sector
US manufacturing activity experienced its first expansion in a year during January 2026, as the Institute for Supply Management reported its manufacturing PMI climbed to 52.6, surpassing the 50 threshold that separates expansion from contraction for the first time in twelve months and reaching its highest point since August 2022. The December PMI stood at 47.9, marking ten consecutive months in contraction territory.
The January improvement reflected surging new orders, with ISM’s forward-looking new orders index soaring to 57.1 from 47.4 in December, the strongest reading since February 2022. Backlog orders increased and exports showed recovery, though the rise in new orders strained supply chains and elevated input costs. The supplier deliveries index rose to 54.4 from 50.1, indicating lengthening delivery times that contributed to the PMI increase but potentially reflecting supply chain disruptions linked to tariffs rather than pure demand strength.
The prices paid component of the survey climbed to 61.0 from 58.5 in December, suggesting goods prices retain upward pressure and potentially keeping inflation above the Federal Reserve’s 2% target for an extended period. Factory employment continued declining, though at a slower rate, with the employment measure at 44.8 versus 44.1 in December.
Regional Federal Reserve manufacturing surveys provided additional context. The Philadelphia Fed’s January Manufacturing Business Outlook Survey showed the diffusion index for current general activity jumping from -8.8 in December to 12.6 in January, its highest reading since September. The new orders index rose 9 points to 14.4, and shipments increased 6 points to 9.5, while inventories fell 17 points to -8.4. Price indexes remained well above long-run averages: current prices paid at 46.9 and current prices received at 27.8, with future price expectations even higher.
Investment and Business Conditions
Business investment patterns display sharp sectoral divergence with critical implications for space commerce. Intellectual property and software investment surged 18% year-over-year in Q3 2025, driven by generative AI infrastructure deployment that creates direct demand for satellite connectivity, data center support, and related services. This AI investment wave represents a major growth driver for commercial space, particularly in Earth observation data analytics, satellite communications capacity, and space-based computing applications.
Conversely, both nonresidential and residential structures investment declined sharply, falling 5.0% and 7.1% respectively, as high interest rates constrained capital-intensive construction projects. Equipment and intellectual property products increased 5.2% and 5.6%, suggesting businesses prioritize technology and efficiency investments over physical expansion.
The space industry’s capital requirements span both categories experiencing headwinds (manufacturing facilities, launch infrastructure) and those showing strength (software, intellectual property, satellite technology). NASA’s FY2026 budget provides substantial support: Exploration Systems Development received $7.612 billion, Space Operations $3.949 billion, and Science $7.76 billion, with an additional $3.09 billion through reconciliation legislation specifically providing multi-year certainty for development programs. Commercial lunar services programs including Intuitive Machines, Astrobotic, and Firefly Aerospace represent over $400 million in task order value, establishing operational cadence that validates commercial lunar access.
Inflation and Monetary Policy
The Federal Reserve held the federal funds rate unchanged at the 3.5%-3.75% target range in its January 2026 meeting, in line with expectations, after three consecutive 25-basis-point rate cuts in late 2025 that reduced borrowing costs to their lowest level since 2022. The decision reflected the FOMC’s assessment that inflation remains above target while growth shows resilience, creating conditions that warrant a pause in easing.
Notably, two committee members dissented from the hold decision: Governors Stephen Miran and Christopher Waller both voted for an additional 25-basis-point cut, revealing internal disagreement about the appropriate policy stance. This dissent, combined with the median dot plot projection of only one additional 25-basis-point cut in 2026, substantially raises the bar for near-term easing and suggests the Fed considers the policy rate closer to neutral than markets anticipated.
Chairman Jerome Powell’s post-meeting remarks downplayed the likelihood of rate cuts in the near term, noting the committee’s confidence in getting inflation back to the 2% target without maintaining highly restrictive policy, though the Summary of Economic Projections indicates the Fed does not expect actual return to 2% until 2028. This timeline inconsistency reveals uncertainty within the committee about the inflation trajectory and appropriate policy path.
The median FOMC projection anticipates an inflation rate of 2.4% by end-2026, down from 2.6% in September, with GDP growth rising to 2.3% from the earlier 1.8% projection. The Fed’s terminal rate estimate of 3% sits 50 basis points below private sector estimates of 3.5%, suggesting potential divergence between the Fed’s assessment of neutral policy and market realities.
Interest Rate Environment and Credit Conditions
Long-term Treasury yields remained elevated above 4.8% since August 2025, creating a persistent headwind for capital-intensive investments including space industry projects. The yield curve dynamics, particularly the 10-year/2-year spread that turned negative for the first time since April 2025, signal tightening financial conditions and elevated recession risk according to historical precedent.
Mortgage rates stood at 6.5% for 30-year fixed-rate mortgages and 5.75% for 15-year fixed-rate mortgages as of the January 28 Fed announcement, contributing to continued residential investment contraction. Credit conditions more broadly reflect the Fed’s cautious stance, with bank lending standards remaining selective and credit spreads indicating investors demand meaningful risk premiums.
For space commerce enterprises, these interest rate conditions create meaningful constraints on debt-financed growth strategies. Launch service providers, satellite manufacturers, and ground infrastructure developers face elevated capital costs that increase project return hurdles and extend payback periods. The bifurcated NASA budget structure—with the Space Launch System receiving $4.1 billion over four years through reconciliation legislation providing multi-year certainty, while commercial programs compete for annual appropriations funding—creates differential risk profiles and investment implications. Government-backed programs enjoy insulation from private credit market volatility, while purely commercial ventures must navigate both higher borrowing costs and more selective equity investment appetite.
Fiscal Policy and Government Spending
Congressional passage of NASA’s FY2026 appropriations on January 15, 2026, delivered $24.4 billion in base funding alongside $3.1 billion through reconciliation legislation, totaling $27.53 billion—the largest inflation-adjusted NASA budget since 1998. This decisive rejection of proposed budget cuts signals bipartisan consensus that commercial space partnerships constitute strategic infrastructure rather than experimental programs.
The appropriations structure reveals competing pressures: traditional annual appropriations process delivered $24.438 billion maintaining oversight, while the “One Big Beautiful Bill Act” reconciliation package added $3.09 billion for FY2026 as part of $10 billion spread over six years, providing multi-year certainty for long-development programs. Major accounts received the following allocations: Exploration Systems Development $7.612 billion (up $128 million from request), Space Operations $3.949 billion, Science $7.76 billion, and Aeronautics $966 million.
The reconciliation versus appropriations split creates a two-tier system with fundamentally different risk profiles. The Space Launch System received $4.1 billion over four years (FY2026-2029) through reconciliation, insulated from annual appropriations battles, while commercial launch services and human landing systems compete for annual appropriations funding, introducing business volatility that shapes company strategy and investor expectations.
Policy Implications for Space Commerce
The 2026 mission manifest demonstrates accelerating flight rate with substantial commercial participation. Intuitive Machines’ IM-3 mission targets Reiner Gamma carrying payloads to study surface composition and magnetic field interactions, Astrobotic prepares its Griffin lander to deliver NASA’s VIPER rover to the lunar south pole for water ice prospecting, and Firefly Aerospace advances its Blue Ghost lander for payload delivery to Mare Crisium. Combined, these missions represent over $400 million in task order value and establish operational cadence validating commercial lunar access.
Looking toward 2027, appropriations process volatility returns as the primary risk factor. The FY2026 budget benefited from bipartisan cooperation and successful advocacy against proposed cuts, but future years face potential headwinds from fiscal pressure driven by deficit concerns, competing domestic priorities, political polarization, and administration transitions after the 2026 elections. Commercial programs funded through annual appropriations remain vulnerable to disruption, unlike SLS’s multi-year reconciliation protection, revealing the fragility of bipartisan consensus despite policy endorsement.
Risk Assessment and Outlook
The US economy faces several material downside risks that would disproportionately impact capital-intensive sectors including space commerce. Recession probability remains elevated as the Conference Board’s Leading Economic Index posted its largest decline since April 2025 in the August reading, driven by weakened average weekly manufacturing hours, increased initial unemployment claims, negative interest rate spreads, and weak consumer expectations. The six-month growth rate and trend analysis increasingly flash recession warning signals that warrant monitoring.
Higher or more extensive tariffs represent a significant policy risk, with baseline forecasts assuming 20% average tariff rates but downside scenarios incorporating more severe trade restrictions that would reduce GDP growth while elevating inflation. Import-dependent supply chains including satellite component manufacturing, launch vehicle systems, and ground equipment would face direct cost pressures. The January manufacturing survey’s elevated prices paid component and supplier delivery delays already illustrate emerging tariff impacts.
Consumer spending collapse risk intensifies as personal savings rates decline to 4.2% and real spending growth projects only 1.4% in 2026 versus 2.1% in 2025. Reduced net migration expected to weigh on spending creates both demand-side headwinds and labor supply constraints. Commercial space services dependent on consumer and business discretionary spending face demand uncertainty in a downturn scenario.
Financial market stress could emerge from elevated long-term interest rates, persistent yield curve inversion, and potential commercial real estate distress spreading through banking sector exposures. Credit availability for space startups and mid-stage companies would contract sharply in a financial crisis scenario, stranding projects mid-development and forcing asset sales.
Upside Opportunities
Productivity acceleration from AI deployment represents the most significant upside scenario, with potential for faster-than-expected growth if generative AI delivers transformative efficiency gains. The 18% year-over-year surge in intellectual property and software investment demonstrates substantial capital flowing into AI infrastructure that creates direct demand for space-based services. Earth observation data analytics powered by AI, satellite-enabled distributed computing, and space-based data infrastructure all position the space sector to capture meaningful value from the AI wave.
Successful disinflation allowing faster Federal Reserve rate cuts would substantially improve conditions for capital-intensive space projects. If inflation approaches the 2% target ahead of the Fed’s 2028 projection, monetary easing could accelerate, reducing borrowing costs and expanding equity valuations. The space industry’s long-duration investments and deferred revenue models benefit disproportionately from lower discount rates applied to future cash flows.
Trade policy de-escalation, while not baseline assumption, would reduce supply chain costs and eliminate tariff-induced input price pressures currently constraining manufacturing margins. Immigration reform providing labor supply enhancement could alleviate skilled labor shortages in aerospace engineering, software development, and technical operations that currently constrain space industry workforce scaling.
Data Sources and Methodology
This analysis incorporates data from authoritative government statistical agencies and credible private sector forecasting organizations. The Bureau of Labor Statistics provided employment, unemployment, and wage data through the Employment Situation Summary and CPI releases. The Bureau of Economic Analysis supplied GDP, personal income, and current account balance data. The Federal Reserve contributed monetary policy decisions, economic projections, and GDPNow nowcasts.
Private sector sources included the ADP National Employment Report for timely labor market insights, the Institute for Supply Management for manufacturing and services PMI data, regional Federal Reserve Bank manufacturing surveys including the Philadelphia Fed Business Outlook Survey, and the Conference Board for Leading Economic Index components. Space sector data derived from the Bureau of Economic Analysis Space Economy Satellite Account and NASA appropriations documentation.
Analytical Framework and Limitations
The analysis follows a comprehensive framework examining GDP components, labor markets, consumer conditions, business activity, inflation dynamics, monetary and fiscal policy, and sectoral implications for space commerce. Data limitations include the delayed release of official BLS employment statistics for January 2026 due to government shutdown impacts, requiring reliance on preliminary private sector indicators. Comprehensive space economy data through 2025 awaits BEA’s next Space Economy Satellite Account update, necessitating extrapolation from 2023 figures and NASA budget allocations.[15][16]
Economic forecasts incorporate uncertainty ranges, with baseline projections assuming policy continuity but acknowledging material risks from tariff escalation, immigration restrictions, and appropriations volatility. The space industry’s intersection with broader economic trends creates both correlations (capital costs, labor availability, discretionary spending) and insulations (government procurement stability, strategic infrastructure designation) that produce complex scenario dependencies.
Conclusions
The January 2026 economic environment presents the space commerce industry with a nuanced combination of supportive government policy and challenging private sector conditions. Record NASA appropriations totaling $27.5 billion establish strong demand foundations for commercial partnerships, lunar services, and research missions, while elevated interest rates and cautious lending standards constrain private capital availability for venture-stage and expansion-phase companies. Manufacturing activity’s unexpected January expansion offers encouraging signals for aerospace production, though supply chain pressures and input cost inflation require careful margin management.
Labor market softening concentrated in professional services and manufacturing categories directly affecting space industry employment necessitates workforce planning flexibility, while sustained wage growth above 3.8% maintains real compensation gains supporting skilled talent retention. Consumer sector resilience through services spending and gradual inflation moderation preserve demand for satellite communications and geospatial intelligence applications, though savings rate compression and spending deceleration warrant monitoring.
The Federal Reserve’s pivot to a holding pattern with limited projected 2026 easing signals that current interest rate levels approximate a medium-term equilibrium, requiring space companies to structure financing assuming persistent 6.5% mortgage rates and corporate borrowing costs proportionately elevated above the 3.5%-3.75% policy range. Fiscal policy provides more favorable conditions through bipartisan support for commercial space programs, though annual appropriations vulnerability contrasts with SLS multi-year protection and creates differential risk profiles across program types.
Strategic imperatives for space commerce participants include optimizing government program participation to capture stable procurement revenues, structuring capital plans for higher-for-longer rate environments, investing in AI-enabled services to capitalize on the sector’s strongest growth driver, and maintaining operational flexibility to navigate tariff-induced supply chain volatility. The next eighteen months will determine which business models successfully transition from development to operational sustainability within this mixed macroeconomic backdrop.
Sources and References
Government Statistical Agencies:
· Bureau of Labor Statistics - Employment Situation Summary, Consumer Price Index, wage data
Private Sector Economic Research:
· ADP Research Institute - National Employment Report
Space Industry Analysis:
· NASA - FY2026 appropriations, Commercial Lunar Payload Services program
Forecast and Analysis Sources:
· Deloitte economic forecast
Web Sources:
1.
Limitations and Gaps:
1. January 2026 official BLS employment data delayed until February 11 due to government shutdown, requiring reliance on ADP preliminary private sector indicators
Conflicts of Interest and Disclosures:
This analysis is prepared as an economic assessment for informational purposes. No financial positions in specific space commerce companies inform the analysis. Government budget figures and appropriations reflect publicly available congressional documentation. Economic forecasts incorporate multiple independent sources to provide balanced perspective.
AI Disclosure:
This report was generated with AI assistance for research compilation, data synthesis, and structural organization, with human oversight for analytical framework, economic interpretation, and space industry implications assessment.